| Main Page | Company Info | Software |
Plotting Collision Points
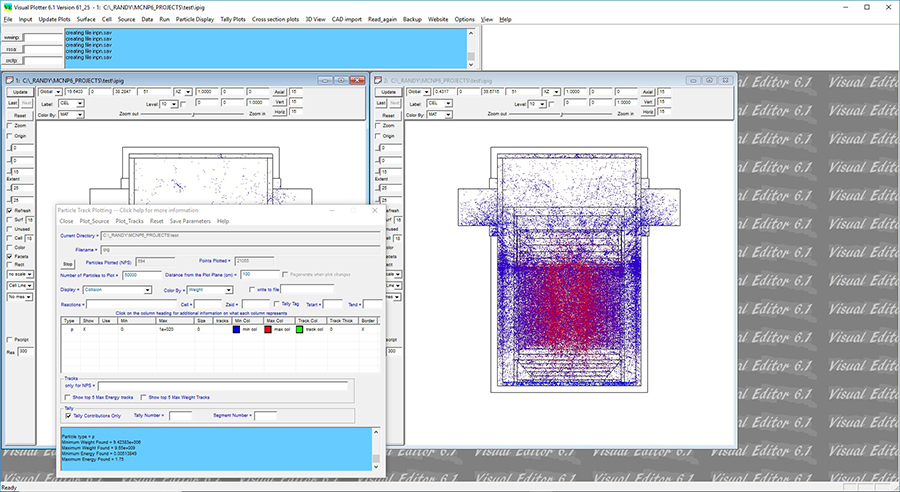
The Visual Editor has the capability of plotting source generation points and collision points. This can be used to better understand how the particles are being transported through the geometry. It can show unexpected streaming paths, poor particle biasing, or display whether the source is generated in the expected locations. Additionally, the user can select only those points that contribute to a tally.
As an example of how this can be used, this figure shows a lead shielded cask. A photon source is located in the cylindrical region in the center of the cask. It was initially assumed that the maximum dose rate was outside the cask, axially centered over the source region. However, by plotting the collisions that contribute to the tally on the outside of the cask, it can be seen that particles are going through a thin steel layer extending from the top of the source region to the outside of the cask.