
| Main Page | Company Info | Software |
KCODE Source Generation
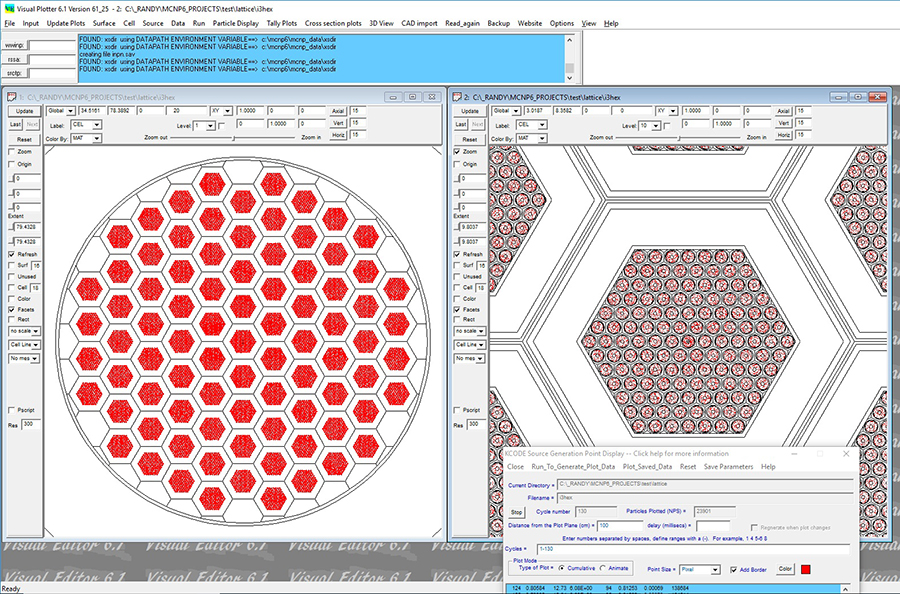
The Visual Editor allows the user to display source generation points as a function of the KCODE cycle.
In this figure, the source generation points (not collision points) for assemblies in a cask are plotted. The right plot shows the cumulative source generation points for the first 20 cycles. The plotting of the assembly geometry inside each hex has been turned off by setting the level to 1. In MCNP®, each universe has a "level number" that indicates the nesting level of the universe. The Visual Editor allows the user to set the plot level number to remove the plotting of the geometry at higher levels. This geometry has a lattice inside of a lattice and thus goes down to level 5. In the left plot, an enlargement of the center assemblies is made and the plotting is at level 3 showing the assembly hex lattice for the pins. The pins inside each hex are not plotted because their geometry is at level 5.