| Main Page | Company Info | Software |
3D Ray-Traced Plotting
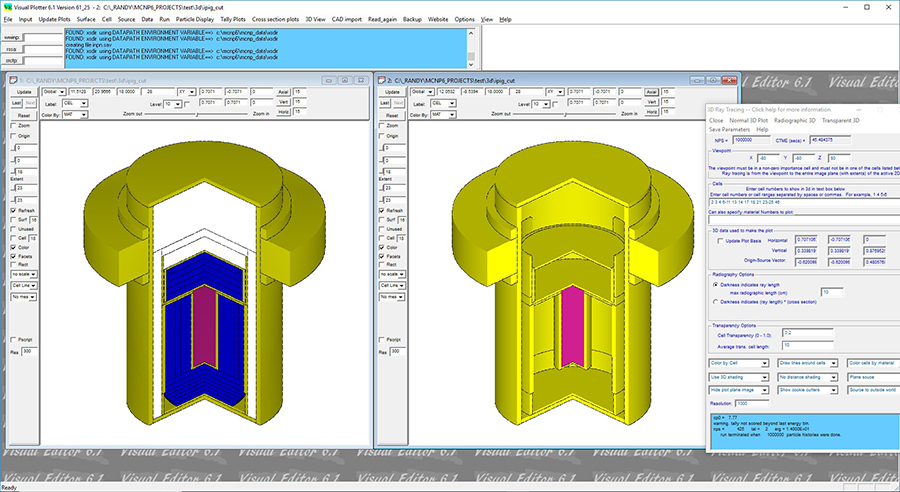
A three-dimensional view of a cask with a section cut out is shown above. The plot was generated by reading in the cask input file and then adding a cookie cutter cell which is used to cut away a region of the geometry. In this case, a quarter of the cask is removed. To create the plot, the user must select a "viewpoint" which is the starting location of the rays. The user must also select the cells to be displayed in the three-dimensional plot.
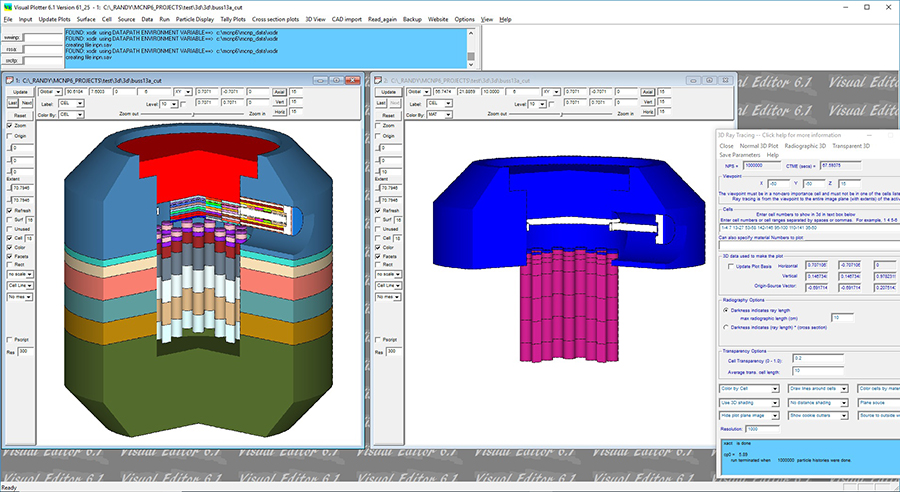
As an additional example, a plot of a buss cask is shown below.